Wednesday, March 31, 2010

Two Companies To Profit From Obama's Expansion of Off-shore Oil and Gas Exploration, For the Long Term

President Obama announced today the expansion of off-shore gas and oil exploration, opening up vast areas o the ocean North of Delaware to Central Florida, and Also Alaska. Certain areas will remain protected, such as Bristol Bay in Alaska, from New Jersey north to Canada, and the Pacific coast from Canada to Mexico.


This is a long term proposition. Two companies that may benefit from this in the long term were recommended on BNN today by Kevin Cook, market analyst with PEAK6 Investments.

They are Transocean (RIG) and Diamond Offshore Drilling (DO). Both have been beaten down lately.

As mentioned, these are long term prospects. RIG, for example, still has lot of drilling equipment idle.


RIG

Transocean Ltd. provides offshore contract drilling services for oil and gas wells worldwide. The company offers deep water and harsh environment drilling, oil and gas drilling management, and drilling engineering and project management services, as well as explores, develops, and produces oil and gas resources. As of December 31, 2008, it owned and operated 136 mobile offshore drilling units comprising 39 high-specification floaters, 28 midwater floaters, 10 high-specification jackups, 55 standard jackups, and 4 other rigs, as well as 10 ultra-deep water floaters under construction or contracted for construction. The company was founded in 1953 and is based in Vernier, Switzerland.

RIG had revenues of $11B in 2009 and has a market cap of $27.78B.

It's forward P/E (fye 31-Dec-11) is 7.95.


DO

Diamond Offshore Drilling, Inc. operates as an offshore oil and gas drilling contractor worldwide. The company provides offshore drilling services in the deep water, harsh environment, conventional semisubmersible, and jack-up markets to independent oil and gas companies and government-owned oil companies. As of December 31, 2009, it operated a fleet of 47 offshore rigs consisting of 32 semisubmersibles, 14 jack-ups, and 1 drill ship. The company was founded in 1989 and is headquartered in Houston, Texas. Diamond Offshore Drilling, Inc. is a subsidiary of Loews Corporation.

DO has a market cap of $12.35B and had revenues of $3.6B in last fiscal year. Its forward P/E is 9.86.

Stumble Upon Toolbar

Now The Irish: Banks Need $43B; Ireland's Deficit is 4X Eurozone Maximum

Those who think the crisis in Europe was finished with the supposed "bailout" of Greece are getting a dose of reality today.

It turns out Irish banks need $43B in new capital "after appalling lending decisions left the country’s financial system on the brink of collapse."

Long time readers will recognize the stock AIB, Allied Irish Banks, in the report, and, unfortunately not in a good way.


According to Bloomberg, as part of a plan to revive the financial system, the National Asset Management Agency said it will apply an average discount of 47% on the first block of loans it is buying from lenders . The central bank giving them 30 days to say how they will raise the funds.

Irelands's Finance Minister said in the parliament “Our worst fears have been surpassed,” “Irish banking made appalling lending decisions that will cost the taxpayer dearly for years to come.”

Allied Irish needs to raise 7.4B euros to meet the capital targets and Bank of Ireland will need 2.66B euros. Anglo Irish, long ago (last year) nationalized needs about 18.3B euros. And the list goes on.

Banks Will Have Majority Government Stake

If Allied Irish can’t raise enough funds, the governmet will have to provide aid. The government will then end up with a majority stake.

The banks “are in a better position today, but we also have to be cautious about thinking we are done and dusted here,” Forbes said.

Ireland Cannot Afford It

Ireland may not be able to afford to pump more money into the banks. The budget deficit widened to 11.7% of GDP last year, almost four times the European Union limit (where have we read this before?).

Stumble Upon Toolbar

Tuesday, March 30, 2010

Bank of England: Financial Crisis Cost Between $60T and $230T; Production Losses Are Permanent

Bank of England's executive director for financial stability, Andrew Haldane, said today that the loss of production resulting from the global banking crisis may be between $60T and $200T trillion.

Haldane noted that the direct cost of the British Government to rescue banks might prove to be small, around 20B pounds, or just over 1% of gross domestic product (GDP) of the United Kingdom.

In this case, eventual demands that banks bear the costs of the crisis would also be small, he said, less than 1B pounds per year in the United Kingdom and under $ 5B annually in the United States.

Haldane warned, however, that the direct cost to the government "almost certainly underestimates the damage caused by the crisis in broader sectors of the economy."

"Evidence taken from previous crises suggest that production losses induced crises are permanent, or at least persistent, as regards the impact on the level of production, not counting its growth rate," he said.

Please take the time to think about what such loss of production would cause to stock valuations.

"If the losses to GDP are permanent, the cost of the crisis can significantly exceed the current numbers," he continued. Haldane calculated that the damage to the entire production could reach between U.S. $ 60T and U.S. $ 200T over the next few years.

In the specific case of the United Kingdom, he noted, the cost would be between 1.8T and 7.4T pounds. However, Haldane argued that the banks are not liable for any such loss, and not just because the amount was beyond their capacity of payment (!!).

"It would be plausible to argue that the damage to production significantly overestimated the damage inflicted by banks to other sectors of the economy," he said. "Others certainly can not be absolved of blame for the crisis. For every irresponsible lender there is probably an irresponsible debtor"

With news from Agencia Estado.

Stumble Upon Toolbar

Morgan Stanley: Current Stock Market Rally Is Near Its End: Debt has NOT Been Reduced, it Only Changed Hands to the Governments (to Us!)

Today there are sombre predictions from Teun Draaisma, Morgan Stanley’s strategist. He says that the recent rally was larger than we expected, and it was due to:

  • no positive payrolls or Fed language change yet; in fact there was some loosening rather than tightening last week: the Greek bailout, the ECB keeping its wide collateral pool for longer, and the Obama plan for troubled mortgage borrowers
  • sentiment had turned quite cautious in early February.

"Nevertheless, we do think the market peak associated with the start of tightening is near, and expect 2010 to show a volatile whipsaw pattern in equities".

Draaisma believes the secular bear market is incomplete. He says that banking crises and bailouts tend to precede debt crises. Furthermore, quite rightly he states that the "amount of debt has not been reduced yet (it only changed hands to the government)".

This of course means that the banks' debts have in fact been transferred to all of us, and to our children.

His historical analysis show that equities tend to struggle for longer in the aftermath of secular bear markets.

"When the next earnings recession hits, perhaps in 2012, we expect equities to complete the bear market that started in 2000".

Stumble Upon Toolbar

Gold To Trade Sideways For a Very Long Time

Here is the latest INO video on gold. They say gold will not make new highs or lows and will trade sideways for a long time (12 months!). According to this, gold will trade between $1,226 and $1058, the reasons are explained in the video: Watch video.


My personal impression is that gold will head lower soon as the USD head higher, then this will reverse several months from now (USD lower and gold higher).

Stumble Upon Toolbar

TLT and TBT VS 10Y and 30Y Treasuries

Here is the third part of our series of posts on TLT and treasuries.


I plotted TLT and TBT on the same chart with the yields of the 10-y and the 30-year US Treasuries.


It is very clear that both ETFs are very highly correlated with both these long term yields. The highs on TLT coincide with the lows, and TBT is the inverse.

Here are the actual calculated correlations covering 2010:


0.91 and 0.95 are very high indeed.

Therefore, if yields rise, you know what will happen the TLT and TBT.

Stumble Upon Toolbar

Monday, March 29, 2010

UBS: Agreement on Greece is Very Bad News for Euro; Greece Needs Another 16B to 25B Euros Soon

In an interview with Agencia Estado, Paul Donovan, global economist at UBS, warned that the there is a significant risk of Greek default on sovereign debt on a horizon of four to five years,.

The analyst argues that the Greek economy is inefficient, is not competitive, which will represent "huge challenges" to the country in four or five years when a new default risk may emerge.

According to the economist, the agreement tailored for the European Union and the International Monetary Fund (IMF) is good news in the short term. "But it's bad news for the euro in the long term."

In the short term, he argued that the agreement broke a deadlock and provided an immediate solution. In the long term, however, he states that Europe was unable to resolve the issue and had to seek help outside the regional union.

"If you need to seek outside help for a problem as small as Greece, which, frankly, is a very small in comparison to the scale of the European economy, it raises concern, in my view,".

Donovan said, however, that Greece is a "small problem" for the European Union. For him, the big problem is that monetary union does not work from an economic standpoint. The analyst argued that the European Monetary Union "does not work economically. It's not a good economy and needs to be reformed in the medium term."

He cited three points needed for a better functioning of the EU economically:

  • First, a fiscal union is necessary, so that the fastest growing economies can transfer revenues from tax collections for those which grow less.
  • There is a need for increased flexibility and mobility.
  • Wages should be adjusted to provide more competition for the savings they need and allow greater mobility for the unemployed search for jobs in other countries in the union.
On the issue of €5 billion in securities priced in Greece today, the UBS economist called the operation 'satisfactory', but has warned it will need to capture power again to honor its debt maturity in April and May.

"There are various estimates about how much they will need, but the amount of debt that is due is between €16 billion and €25 billion."

Also in relation to sovereign debt, Donovan held that there is no logical reason why the United Kingdom will have its credit risk is lowered. "There is no reason why a country that has a stable political system and is able to print its own currency should be something that is not AAA,"he said. The whole purpose of credit rating, "is to assess whether the lender will get the money back after all,".

Stumble Upon Toolbar

The Amount of Gold Traded Daily is Almost Half of Gold's Yearly Production

Phil Davis (the options expert who runs a daily trading chat system) reports today that 1,625 tons of gold are mined on an annual basis but the LBMA is trading 20M ounces (625 tons) per day.

  • That is 150,000 tons a year,
  • this is the sum total of all the gold that has ever been produced in history
  • it is roughly 100 times the actual physical float of gold and most of that float is being churned over and over by the various ETFs who have been doing 1/3 of the world’s buying for the past 5 years.
Says Phil:

"Does the lack of actual gold make the bullion you hold more valuable? That’s an interesting question. Mortgage backed securities didn’t get more valuable as mortgages diminished in value but I suppose this gold scam can keep going as long as no one actually asks for their physical gold. I would advise having actual gold if you are using it as a hedge and not trusting your fate to contracts that may never be able to make good on the physical delivery they promise. Overall though, I don’t think much of gold as an investment. Gold historically had value because it was scarce, difficult to produce and easy to verify - I could make the same argument for old baseball cards or comic books and my daughter would trade them all for a "
Legendary" Pokemon she’s been looking for.

Where, ultimately does gold find value? It reminds me of something written a long time ago in Marginal Revolution about fiat currencies and Gilligan’s Island. "In early episodes, we see Mr. Howell hiring various services from other castaways. We eventually learn he’s been writing checks on a mainland (and therefore inaccessible) bank. This works while the group consider their condition temporary, but the checks are quickly devalued and eliminated when the castaways begin to prepare for the possibility of an indefinite stay on the island. In Episode 9, "The Big Gold Strike," Gilligan and Mr. Howell find a gold mine on the island, which Howell convinced Gilligan to keep secret from the others. By the time everyone learns about the mine, Howell has already taken the lion’s share of the most easily accessible gold. He’d like to hoard it for himself, but the other castaways begin charging him for their goods and services."

You may have your 8 pounds of gold ($150K) when the world falls apart (or whatever the fantasy end game is for gold bugs) and you may lug it over to the store to buy some clean water or use it to barter for medicine when you get sick but who’s going to set the price for you then? How much will be a " fair" exchange when the exchanges fail? That’s the real difference between gold and oil - gold can float to extremely unrealistic levels and then drop like a rock because - when push comes to shove - no one NEEDS it. Oil, on the other hand, must ultimately be consumed every day and raising the price can diminish demand and vice versa. Raising the price of gold, however, stampedes more and more people into ETFs that buy more and more gold (or at least contracts for gold as we have now learned) which raises the prices and brings more and more people into the ETFs, who order more gold, etc… What can go wrong with that?"

Stumble Upon Toolbar

DOE: Peak Oil is Here

Believes of peak oil theory will love the following chart. The interesting part is that it was taken from this presentation from the DOE.


The black line at the top of the chart shows the consumption. According to this chart, "peak oil" is next year.

Stumble Upon Toolbar

Chart of Evolution of Treasury Yields Since Mid 2009: Pointing to Higher Rates

TLT has dropped considerably in the last couple of weeks, and treasury yields have increased.

I plotted the yields of US Treasuries, from 3 month to 30 years, since the middle of 2009, until last Friday:


(please click to enlarge)

The yields have clearly been rising in recent weeks, which is reflected in the poor auction results.
Shall the yields continue to rise, we can expect a further drop in certain bond ETFS such as TLT, and rise of inverse ETfs such as TBT. The Fed has however said that interest rates will not rise, but those are only the ones they control, which are short term rates.

Note however, that the low in yields for the 10y and 30y was around Oct 4th, which corresponds to the local high on TLT.

Please see last week's post on this subject and how to play this situation.

This chart compares TLT and TBT:


TLT:


TBT:

Stumble Upon Toolbar

Chinese Are Snapping Agricultural Land in Canada

Canadian newspaper Ottawa Citizen reports today that Chinese investors are buying Canadian farmland, raising many concerns throughout the country.

The issue is Chinese' growing middle class. Hundreds of millions of people in China modified their eating habits and are consuming vastly larger quantities of meat and higher protein foods. There isn't simply enough arable land in China to meet this new demand. hence, the Chinese interest in fertilizers and agricultural lands (not to mention base metals and other materials).

In Canada, Quebec's agricultural producers union is making noise expressing concern that by Chinese buying large tracts of agricultural land in the province constitute a food security issue and that it may be related to a new international property speculation in agricultural land.

Both would drive up Quebec farm prices.

The report states that Canadian western farmers are also unreceptive to the Chinese interest in their lands, citing a firm called Monaxxion, which is looking to buy 40,000 hectares of land in Canada

Farmers are leery of Monaxxion.

"Sherbrooke's La Tribune newspaper reported Friday that a farmer in St. Clotilde de Horton recently backed out of a tentative $30-million deal with Monaxxion after concluding the firm and its clients weren't as solid as he had been led to believe".

Te article mentions that fears are growing about the Chinese motives as "China has been investing heavily in agricultural land in Africa and other Third World nations. China has 20% of the world's population and an increasingly wealthy middle class"

"China has been actively seeking new supplies of food, hydrocarbons and other commodities on international markets.The country has been trying to buy into Canada's oil sands developments. It has reconfigured its foreign-aid programs to concentrate on helping countries such as Zambia that have rich copper deposits. And it has worked diligently to develop closer relationships with oil-rich countries such as Iran".


Daniel Mercier Gouin, a professor of agricultural economics with the Université Laval says there is no longer any doubt that the world is seeing the beginning of a speculative boom in agricultural land.

"To date, there have been plenty of inquires and even purchase offers by Monaxxion, but nothing really solid in terms of sales.
However, Bergeron of Monaxxion says there are some important transactions being negotiated right now. And he said he plans to make his investors more open for public scrutiny".

Disclaimer. The writer owns shares of CRESUD, which own large areas of farmland in Argentina. The shares have done extremely well since late 2008.

Stumble Upon Toolbar

Sunday, March 28, 2010

The Top Gold and Metals ETFs for April and Q2 2010

With the end of March and Q1 2009 we are starting to look at the best values for April and Q2 2010. We computed the relative strength values of all gold and metals ETFs and ETNs on the market. These indicators are great to see whether an ETF is overbought or oversold.

We track all gold ETFS live here.

Here are the results.

Short term:

Ordered by the RSI daily.


Most oversold are USV (silver ETN) and UBG (gold ETN). The only overbought is JJN (nickel)

Long term:

Sorted by RSI monthly.


Most oversold are ZSL (ultra short silver) and GLL (ultra short gold). The only overbought is JJN

Overall:

Sorted by our favorite measure RSIA which more closely mimics optimal results.


The closest to oversold are again ZSL and GLL, while only JJN is overbought. These ETFS are confirmed as overbought and oversold. Nothing prevents them from becoming more overbought or oversold, but the odds are against them.

Note: You may receive technical analysis and alerts of these stocks, sent automatically to you, by entering the symbols in the Technical Trend Analysis Tool, (powered by INO).

Stumble Upon Toolbar

Saturday, March 27, 2010

Roubini Shifts to Italy: Country Has Very Difficult Structural Challenges

After Greece, Nouriel Roubini is also warning that the risks to Italy's structural challenges in the long run are also difficult, although its risks are lower than those of other countries in the euro zone with weak fiscal position.

According to him, Italy has a high public debt, but has not implemented any fiscal stimulus. Please see our post on this matter showing Italy to be the fifth worst country.

Its long-term challenges, however, such as increasing the productivity gap with Germany, are very great for Italy. He said "there is a certain complacency in Italy." He adds that the country, as well as Greece and Spain, must embark on structural reforms to the German style, involving containment of wages and increase productivity.

The process should take a decade to bring results. Roubini cited the case of Germany, which showed weak growth from 1996 to 2006.

As reported here, yesterday, the vice president of the People's Bank of China, Zhu Min, expressed concern over Italy in comments on the fiscal crisis in Greece and the euro area. "Greece is only one case is the tip of the iceberg," said Zhu. According to him, "the main concern today is obviously Spain and Italy."

With news from Agencia Estado.

Stumble Upon Toolbar

Friday, March 26, 2010

Craig Wireless Sells Spectrum: Stock +250%


Lucky owner of shares in Craig Wireless (CWG) are 250% richer today. The Canadian company announced it s selling part of its wireless spectrum to giants Rogers and Bell.

  • Canadian spectrum a quarter of total spectrum holdings
  • Shares rise four-fold
March 26 (Reuters) - Craig Wireless Systems Ltd said it agreed to sell its Canadian spectrum assets to Inukshuk Wireless Partnership for C$80 million, triggering a four-fold rise in its shares.

Stumble Upon Toolbar

Bernanke is Walking on a Greased Tight Rope: Will TLT Go Up or Down?

I could not resist posting this quote from Seamus, who contributed the great article on DBV here back in November.

"Bernanke is on a tight rope walking, trying to keep his balance, only it's
the end of March fast approaching and all of a sudden, the rope has grease on
it." © Seamus 2010

Yesterday we were discussing the effects of interest rates on mortgages and TLT and the fact that Bernanke does not control the long bond yields, the market does.

The questions is whether investors should buy or sell TLT.

If there is another sharp drop I favor the chances that there will be another flight to safety, and thus, TLT will rise.


In situations where TLT can go up or down, our favorite straddles come into play. Here are TLT straddles for June 2010 and Jan 2011:

These were computed with our StraddlesCalc tool and how the number of contracts to buy for a $1k and $2k position on each side of the straddle, as well as the maximum move needed for the position to be profitable.

Note that the 2011 puts are far more expensive than the calls, even though their strike (85) is further away from the current price than the call strike. As it stands, on the down branch TLT would need to drop to $76.36. This seems like a nutty trade right now.

Disclaimer: the author does not own any TLT at the moment.

Options are dangerous and may cause 100% loss. lease do your own due diligence. This is not advice.

Stumble Upon Toolbar

Deliquent Mortgages Jump Again: More Foreclosures Coming

Reuters reports today that the percentage of mortgages that are "current and performing" fell to 86.4% at the end of the Q4 2009. This is down 0.9% from the Q3 and marks a decline for an amazing seventh consecutive quarter. The report was by the Office of the Comptroller of the Currency and the Office of Thrift Supervision.

On a year over year basis, it was down 3.9% from a year earlier.

"The decline was attributable to a 21.1 percent jump in mortgages 90 or more days past due, to 4.7 percent of all mortgages in the portfolio at the end of 2009".

More foreclosures

The report adds that the jump in seriously delinquent mortgages is likely to lead to a rise in foreclosure actions.

The report defines "serious delinquencies" as those loans 60 days or more past due and loans delinquent to bankrupt borrowers.

"In this regard, servicers reported that they expect new foreclosure actions to increase in the upcoming quarters as many of the mortgages that are seriously delinquent may eventually result in foreclosure as alternatives that prevent foreclosure are exhausted," the report said.
Home forfeiture actions -- foreclosure sales, short sales, and deed-in-lieu-of-foreclosure actions -- increased by 8.6 percent from the previous quarter to 163,224. That is up 44.5 percent from a year earlier".

"The number of newly initiated foreclosures, however, dropped by 15.4 percent from the previous quarter to 312,529 after remaining steady the three prior quarters.
But that is up 19.0 percent from a year earlier. The number was curtailed as more loans are held in a delinquent status for an extended period as borrowers and servicers pursue alternate workout solutions, the report said"

Stumble Upon Toolbar

Roubini: Not Sure New I.M.F./Eurozone Greece Bailout Plan Makes Sense

Speaking with reference to Greece mixed "deal" announced yesterday, Nouriel Roubini was quoted as saying “I’m not sure if it makes sense” with regards to only provide support in case of an emergency, and that his worry is that "the EU may be imposing even more fiscal austerity than necessary,” Roubini confirms that that there should have been money offered right away.

He added:

“It’s a compromise between the German views where they wanted to have a greater role of the IMF in the support of Greece and the views of the rest of the euro zone, especially France, where they wanted a European solution,” “An IMF solution would have been a cleaner one because the IMF has the experience”. His declarations were made to Bloomberg TV.

The "plan" specified that:

  • Each euro-region country would provide non-subsidized loans to Greece based on its stake in the ECB.
  • Europe would provide more than half the loans
  • IMF would provide the rest (was the I.M.F. consulted?)
  • The plan would be triggered only if Greece runs out of fundraising options.

Roubini says that it would have made sense to frontload some support and provide loans below- market rates, “to make sure there isn’t a self-fulfilling refinancing crisis,”

“Even a country that does fiscal adjustment might have a refinancing problem, so you need to have a meaningful amount of money on the table.”

Because the I.M.F is involved “in the game,” European leaders have “essentially given final veto power for any financial aid to Germany,”

Stumble Upon Toolbar

Markets Drop During Earnings Season: Watch Out For Mid April

Notwithstanding the chaos in Greece and currencies, please take a look at the blue lines on this chart of SPX, the S&P500 index (SPY ETF).


Notice the drops marked by the blue lines) happened right around the 18th/20th of both October 2009 and January 2010. This happens to be related to earnings season. The reason could be that that markets having risen so much were quite overvalued, and the earnings or guidance disappointed because they had been compared to the previous earnings when the markets was recovering from the 2007/2008 crash.

In other words, positive surprises will be harder and harder to come by. Given that the markets are even more overvalued now, there is reason to expect similar behavior.

In the current earnings quarter that would now be April.

Stumble Upon Toolbar

Thursday, March 25, 2010

Bernanke Confirms Goldman Sachs: Interest Rates To Stay Low

In a session of the Committee of the House Financial Services on exit strategy and its effect on the recovery of the economy, Ben Bernanke confirmed today what Goldman Sachs' Chief Economist said yesterday: interest rates are still at exceptionally low levels and are necessary to support the U.S. economy.

He added the usual words that the Fed is "ready to tighten credit when necessary to avoid inflation". In describing the steps the Fed can take to tighten credit during

"The economy continues to require support of monetary policies," "However, we have worked to ensure we have the tools to reverse, when it's time, the currently very high degree of monetary stimulus."

He added that the Fed has "total confidence" that when the time comes, it will be ready to prevent the emergence of inflation.

Bernanke said the Fed will be able to drain the large reserves of banks by means of reverse purchase agreements and term deposits, extending its control over the economy by increasing the rate paid on excess reserves.

"The use of purchase agreements and reserve deposit lines will allow the Fed to drain hundreds of billions of dollars from the banking system quickly, if it chooses this alternative," reiterating that the central bank plans to conduct transition tests this spring.

Bernanke also reiterated that the raising of the rediscount rate for a month does not represent a broad tightening of credit for households and companies. The instruments and their sequence of use by the Fed to tighten monetary policy will depend on the behavior of the economy.

Stumble Upon Toolbar

Natural Gas Drop to Lowest Prices on Record

We knew this last week here... The futures contract for natural gas dropped to its lowest price on record after government reported inventories that grew for the first time this year, adding to already bloated reserves.

The Energy Information Administration said that at 1.63T cubic feet, natural gas levels are 8% higher than the five-year average.

Storage looks absolutely dreadful, it looks like it will again breach the top of the 5-year channel (agains!?)


Natural gas for April delivery dropped 0.159, or 4%, to $3.94 per 1,000 cubic feet, on the New York Mercantile Exchange. Prices fell as low as $3.94 earlier in the day, the lowest on record for the April contract.

The equally horrible UNG ETF drops 2.80% in response, to an all-time low.


Straddles posted last week are currently up 7%:

Stumble Upon Toolbar

How Good and Bad Countries Are: Global Country Debt as Percentage of Tax Revenue

The media and blogs worldwide discuss much about debt as a percentage of GDP. However, GDP does not tell the whole story. GDP is reported differently by each country (for example China 's is quite a different). Debt should be issued against the ability of the borrower to pay back, which is in direct relation to its tax revenues in the case of countries, not GDP. GDP can be quite irrelevant.

A better measure may be debt as a function of tax revenue.

Here are the top countries, ordered in decreasing order of public debt as percentage of tax revenue, plus some countries of interest such as Greece, Portugal, Ireland, Chile and Argentina.

The worst is Japan, at 601.1%, followed by Mexico at 339.2%, Greece at 244.3%. The U.S. is 6th at 144.7%.

Best among industrialized nations is Australia at -39%.

Note the outstanding performance by Chile at -47%.

(please click to enlarge)

Disclaimer. This refers to public debt, not gross debt. It does not include states and municipalities, for example. The data is obtained from several sources including wikipedia, OECD and Trading Economics, and it includes approximations and estimates. Besides, published data is revised all the time and some countries report it in different ways. China's and Russia's are cases that require extra checking.

Stumble Upon Toolbar

Chaos in Currency ETFs; Most Expensive is Canadian Dollar

Which is the most overbought currency ETF?

In the long term, it is the Canadian dollar (FXC):


FXC is dead last on this list sorted by monthly RSI.

The cheapest is clearly the British pound, FXB.

In the short term, FXB's cousin GBB is the most oversold and YCS (ultra short yen) is the most overbought (so the yen is oversold).

We track all currency ETFs live on this site.


Stumble Upon Toolbar

China: Greece is Just the Tip of the Iceberg

Zhu Min, Vice President of People's Bank of China (Cina's CB), today expressed concern about the fiscal crisis of the euro area, criticizing the European currency for fear that the problem could spread beyond Greece .

"Greece is only the tip of the iceberg,"

"I do not think that Greece will break because it is still relatively small, but we do not see decisive action to tell the market 'we can resolve this, we can finish this', so the market is very volatile,"

"The main concern today is obviously Spain and Italy."

With news from Agencia Estado

Stumble Upon Toolbar

U.S. Treasury To Sell Citi Shares

Bloomberg reports today that The U.S. Treasury intends to sell its 27% ownserhip of Citigroup Inc. using a "preset trading plan" which locks the government into a selling schedule.

As to who will be in charge of the sale, Citigroup itself applied for the job and offered to do it for a discount, according to the report. This is not likely as it would appear as a conflict of interest. Several firms are running, including JPM, GS, and MS. Whoever gets its will undoubtely earns even more millions in profits.

Last year, the Treasury converted $25B of the bailout funds into common shares at a price of $3.25. The current price is $4.15, for a current Treasury stake of $31.9B, or a paper profit of $6.9 billion.

One would expect C shares not to fall until then.

Stumble Upon Toolbar

The I.M.F, Greece And Their Effects on U.S. Dollar and Gold

Germany's Angela Merkel is on the news again today defending an IMF bailout of Greece. Clearly there is no appetite for Germans to volunteer money for the Greek's own faults.

Merkel told German lawmakers in Berlin today:

“A good European is not necessarily one who rushes to assist”
Since the U.S is the largest share owner of the IMF (17%), questions have arisen as to whether the US dollar is the one that will suffer as the U.S is forced to issue yet more debt.


Last year there was much fanfare about the IMF supposed sale of hundreds of tons of gold to India (actually SDRs, which India had received in July, but we digress).

So the question is, why couldn't the IMF simply sell more gold in this case too? The amount in question is relatively small at $10/$15B.

In this case, the price that could suffer is that of gold.

Stumble Upon Toolbar

Wednesday, March 24, 2010

Goldman Sachs Chief Economist: No U.S. Rate Hikes Even by 2011; U.S Weight In the World Overestimated; Brazil to Raise 3.75%

Jan Hatzius, Goldman Sachs' U.S. chief economist, gave an interview in Brazil yesterday.

Mr. Hatzius is part of a team of analysts known for pessimism. In the interview he lives up to its name. Some of his points:

  • Recovery. There will be a recovery (in the U.S.) but it will be slow. It will take time for the Fed and the tax policy makers to change their concerns about unemployment by concerns over inflation." he adds that it will take a long time for the labor market really provide improvement.
  • Interest Rates. He does not expect a rise in U.S. interest rates not even in 2011, but it will depend on the performance of the economy.
  • The economy grew at an annualized rate of 5.9% in the last quarter of 2009. However, two factors have stimulated this growth: tax policy and the inventory cycle. This will not occur in 2010 with the same intensity of 2009.
  • U.S. On average, the U.S. economy will grow 2% per quarter in 2010.
  • Believes that in 2011, U.S. growth will stay above potential and unemployment will begin to fall.
  • Crisis. The worst of the crisis in the U.S. is behind us. There is a feeling in the financial, securities and stock markets that conditions are much more normal today than they were six months, one year and one and a half years ago. The sector that still suffers pressure is banking. The willingness of institutions to offer credit to customers is still limited.
  • U.S. Growth meaning to the world. Asked what does the fact that the U.S. will grow below potential for some time mean for the world, he answered that people overestimate the link between the growth of the world and the United States. Even with an American growth in the range of 2%, he thinks it possible for countries that have had no problems with imbalances, notably the BRIC countries (Brazil, Russia, India and China) to sustain global growth.
  • World growth. He believes that world growth will exceed current estimates, despite being more cautious about the expansion of the U.S. The BRIC countries are being driven by domestic demand.
  • Yuan. The decision on what to do with the exchange rate in China is strictly of the government of China. The U.S. government knows this. He believes that China, for its own interest, will revalue its currency in 2010 and also in 2011 and that the policy of gradual appreciation of the currency will resume. The U.S. government can take action, but it would be counterproductive.
  • Stock Market. When asked about the spectacular performance of the stock market in 2009, he says that stocks were severely undervalued and people were expecting a second Great Depression. Now we are in an area that is closer to neutral. We are not close to another bubble, but neither are we in a time of undervalued prices.
  • Risks. The main risk to the global economy today is for the G-3 (U.S., Europe and Japan) to withdraw too early their fiscal and monetary stimulus. In the emerging world, the risk is of overheating. There are signs of that in many of the BRICs. That is why GS is expecting significant interest rates hikes in Brazil (the bank provides a full cycle of increases in the Selic rate of 3.75 points, to 12.5% per year).
  • China. Their projection for Chinese GDP growth is 11.4% this year, a pace that is "very, very rapid".

Stumble Upon Toolbar

PBR, Petrobras, To Invest $220B

PBR, the Brazilian oil giant and world's 2nd most profitable company, confirmed today that it will invest $220B for the period 2010-2014.

In order to invest this kind of money, the company will need to raise funds. The amount raised will vary depending o the value of a barrel of oil. As mentioned here last week, this will occur in the first half of 2010.

According to José Sergio Gabrielli, PBR's, President:

  • If the price of oil is $64, the company will raise $15B
  • If the price of oil is $80, the company will raise $25B.
The funds raised will constitute a minority ownership.

Interestingly, the current relative strength values are 42.70, 51.44, 50.65, right into neutral territory.


We track PBR live in our Live Tracking site of latin-american ADRS.


Investment protection in the face of a global melt-down

The company (and Brazil) is sitting on huge oil deposits. Barring a 2nd depression or some similar event which could severely restrict the demand for oil for many years, this may be the place to be given the funny money being printed in Europe and the US to pay bad debts.

These are the optimum buy alerts produced by our own Risk Analysis tool (green signals):


Disclaimer: The author does not own PBR.

Stumble Upon Toolbar

Profit and Protect From the Upcoming Chaos in Currencies: U.S. Dollar, Euro and Gold

In light of all the recent events going on with Europe (Greece bailout, I.M.F or not, Spain default, etc, etc,, etc,), currencies are in near chaos. What will happen depends on too many factors. if the US is forced to bailout Greece, then the US is basically aiding Greece causing all sorts of nasty effects on the Euro, the US dollar and possibly gold. Then there is China's surprising trade deficit, and Japan's tragic fiscal situation.

Our favorite way to play them: straddles. here they are for UUP, FXE, and GLD.


Computed with StraddlesCalc Tool which shows the maximum moves required to achieve profitability. The moves are for April straddles and are all under 4%.

Please do your own due diligence. This is not advice. Options are very dangerous and may cause 100% loss.

Stumble Upon Toolbar

Pravda: Euro Doomed to Collapse: Target 1.20, Spain Near Default

Russian newspaper Pravda reports today that the Euro is doomed to collapse. It argues that Portugal, grece, Italy and Ireland will suffer enormous pressure to cut stimulating programs, which is what would have allowed them to escape recession. This new recession in Europe will tirgger a drop in the Euro. Also, mentions may ne near the edge of default.

"The European Union still has no coordinated approach to the current events in Greece. The transatlantic financial politics may split and result in the collapse of the European currency. The euro has already plunged below the level of $1.35. Experts say that the euro has fallen under the strong influence of political discrepancy between EU leaders in connection with Greek events.

The joint European currency may find itself between two traps formed by the policy of the European Central Bank and decisive actions taken by the USA’s Federal Reserve System.
Two leading economies of the world follow different principles in forming their financial policies. Therefore, the euro will continue declining in the near future and may soon reach the level of $1.20 per one euro, experts of BlueGold Capital Management said in their report.

European countries have no single approach to the problems of the crisis in Greece and the support of the euro. Germany is said to be the adversary of any decisive measures at this point.
Experts say that the German government is interested in the reduction of the Euro rate, because the cheaper euro would expand the nation’s exporting capabilities. China has recently become the world’s No.1 exporter instead of Germany, which raised serious concerns in the European country. Germany would like to retrieve its export status to euro’s detriment, specialists say.

Such a position contradicts to general interests of the European Union. Many EU states are not so dependent on export as Germany is. Analysts say that another European country – Spain - may near the edge of default very soon in the event Germany does not provide direct financial assistance to Greece.

Spain’s budget deficit in 2009 made up 11.2 percent, which is very close to Greek numbers.
For the time being, no one knows how the EU is going to solve its problems, and what is eventually going to happen to the euro. Time will show".

Stumble Upon Toolbar

Greece: Merkel Emerging as Victor, Euro Bailout To Open to I.M.F.

German magazine Spiegel reports today that Angela Merkel is emerging as the vivctor in the batle of who will provide aid to Greece. She had been the standalone potions against the demands from the rest of the European Union to promise financial aid to Greece.

Things have changed and France's Sarkozy seems to have shifted to her camp. France is now open to the IMF aid.

"France and most other EU countries had long rejected the idea of IMF intervention. But now that Merkel apparently has the support of French President Nicolas Sarkozy, as the Süddeutsche Zeitung reports on Wednesday, the rest will likely be easier to convince. Should help for Greece become necessary, some EU countries could contribute bilateral loans in addition to a financial injection from the IMF. In government circles in Berlin, there was cautious optimism about "initial signals from various capitals" that officials there could imagine financial assistance coming from the IMF."

Greece must still refinance €50B in debt this year. With its poor credit rating borrowing money has become very expensive for the country.

Euro zone debt coming up:


(please click to enlarge)

Stumble Upon Toolbar

S&P500 Companies and Markets Are At Extremely Overbought Levels

We computed the relative strength index values of all companies in the S&P500. The average RSI7s are now:

  • short term: 67.46 (vs. 64.34 yesterday)
  • medium term: 67.58 (vs. 66.62)
  • long term: 64.83 (vs. 64.86)
That is an average increase of 2.06%. Clearly the increases are showing signs of saturation, as yesterday it was +3.67%.

In terms of overbought versus oversold:

Number of oversold companies:
  • short term: 10 (yesterday: 15)
  • medium term: 2 (yesterday: 3)
  • long term: 1 (yesterday: 1)
Number of overbought companies:
  • short term: 233 (yesterday it was 192); most overbought is CTAS (95.83)
  • medium term: 234 (yesterday: 218); most overbought is TSN (94.33)
  • long term: 183 (yesterday: 157); most overbought is HSP (91.12)

On average the ratio overbought to oversold is now a huge 50.0 (it was 29.8 yesterday). Simply amazing.

Stumble Upon Toolbar

Tuesday, March 23, 2010

China Registers Trade Deficit of $8B in Early March: No Yuan Appreciation, and no US Treasury Purchases?

Chinese Premier Wen Jiabao said China's trade surplus has dropped in recent months, moving its trade balance to a deficit of about $ 8 billion in early March.

So much for all the talk and cries for Yuan appeciation, and maybe future U.S. Treasury purchases? What an answer from the Chinese!

This deficit, which would be the first month since April 2004, may weaken the argument for the appreciation of the yuan, at a time when international pressure for currency appreciation has grown.

Mr. Wen added that Chinese economic growth last year "was reached primarily based on domestic demand," Since then, the Chinese surplus has decreased, and the first one-third of March, China registered a trade deficit of about $ 8 billion.

The Chinese Premier was also quoted as saying "To be honest, I am very happy with it,".

The comments follow a statement made Sunday by the Minister of Commerce Chen Deming, alerting to the fact that China will record a trade deficit in March. The final figures will not be released before April 11, but the revelations of the Chinese authorities show a stronger government defense of a policy that is generating strong criticism from its trading partners.

Keep in mind these are Chinese numbers.

With information from Agencia Estado.

Stumble Upon Toolbar

Impact of Apple's iPad on Amazon Revenue: Shorting QQQQ Not AMZN

There is noise on financial blogs about shorting Amazon (AMZN) here in light if the imminent loss of sales due to Apple's iPad (AAPL).

Using data from Barclays, Rory Maher estimates that if Amazon were to lose its e-book market share from the current 60% to 25%, its effect on revenue would be a drop of 2.0%:


Amazon had total revenues of $24.5B in 2009, with an estimated $250M derived from the Kindle. Now Mr. Maher estimates revenue due to Kindle and ebooks at $1.5B for 2010 and makes his calculations based on that higher figure. That is a big jump from 2009. If the actual sales of Kindle/ebooks is much lower, then the effect on Amazon will be much smaller too.

Amazon's RSI7 are at 54.51/61.35/73.27. Only the monthly is slightly overbought, and it still compares favorably to QQQQ whose numbers are at 77.24/76.24/74.7, overbought on all counts.
The optimum RSI to sell Amazon is Rsi9 (computed by our own Risk Analysis tool) , and a sell alert was issued on Dec 1 when it was trading a $142.5:


Today AMZN trades at $128.82:


Relatively speaking, the odds favor shorting QQQQ at this point.

Disclaimer: The author does not hold AMZN, but just bought puts on QQQQ.

Stumble Upon Toolbar

S&P500 Index: Ratio Overbought to Oversold is 30:1

The S&P500 started the day significantly overbought yesterday, and ended the day even more overbought:

The average RSI7s are currently:

  • short term: 64.34 (vs. 61.42 yesterday)
  • medium term: 66.62 (vs. 64.63)
  • long term: 64.86 (vs. 62.84)
That is an average increase of 3.67%.

In terms of overbought versus oversold:

Number of oversold companies:

  • short term: 15 (yesterday: 16)
  • medium term: 3 (yesterday: 5)
  • long term: 1 (yesterday: 1)
Overbought:

  • short term: 192 (yesterday it was 164); most overbought is CTAS
  • medium term: 218 (yesterday: 178), most overbought is EL
  • long term: 157 (yesterday: 146), most overbought is MJN
On average the ratio overbought to oversold is now a gigantic 29.8.

The two worst companies in terms of our favorite RSI-A are MYL and MIL, both related to the health sector.

Stumble Upon Toolbar

Health Care Stocks and ETFs: The Winners And The Losers

Following our post yesterday (live tracking of health care stocks and ETFs), here are the winners and losers from yesterday:

Biggest winner: MDT (Medtronic): +2.25%

Biggest loser: UNH (United Health Group): -3.17%

Stumble Upon Toolbar

Monday, March 22, 2010

Top Companies in The S&P500 To Buy or to Sell: OverBought Outnumber Oversold 22 to 1

We computed the relative strength values of all companies in the S&p500 for three time frames, short (daily), medium (weekly), and long (monthly).

The average RSI7s are remarkably similar:

  • short term: 61.42
  • medium term: 64.63
  • long term: 62.84
However, the number of overbought and oversold companies is quite different.

Oversold:

  • short term: 16; most oversold is NBR (15.78)
  • medium term: 5, most oversold is BSX (23.25)
  • long term: 1, most oversold is AIG (27.85)
Overbought:

  • short term: 164 (!); most overbought is LMT (94.67)
  • medium term: 178 (!), most overbought is EFX (93.42)
  • long term: 146, most overbought is MJN (92.39)

Clearly there are too many overbought companies. In aggregate, there are 22.1 overbought companies for every oversold company. In the long term they are 146:1, the lonely one there is AIG, which is overbought in the short term. Amazing!

Here are the top 30 oversold companies, sorted by our favorite RSIA, in descending order:

There are 147 companies oversold by RSIA.


Disclaimer: The author does not own any of the mentioned stocks.

Stumble Upon Toolbar

Profit From the Heath Care Bill: The Top Health Care ETFs To Buy And To Sell

Yesterday we wrote about the top health care companies in terms of what is oversold and what is overbought.

We have now added heath care ETFs to our live tracking system. The ETFs are listed below the top companies. Here is the current situation:


And there are our favorite measure, current RSIA values:


The most oversold ETFs are RXD, which is an ultra short for health care sector. The most overbought are RYH (Rydex equal weight health care), IHF (iShares Dow Jones Health Care), and IBB (iShares biotech).

Clearly the sector is overbought.

Stumble Upon Toolbar

Sunday, March 21, 2010

Health Care Plan: The Top Health Care Companies To Buy and To Sell

The Health Care plan is in everyone minds. It wil have profound implications for the health care industry worldwide. As readers know, we track the top global health care companies live here.

Here is the current status:

Performance since Jan 2009:


RSIs

We computed the relative strength values of all of them, and sorted by our preferred RSIA:


The most undervalued company is PFE and the teo top most overbought are BMY and NVO.


P/E

We also sorted them by Price/Earnings ratio (P/Es as reported by Google Financial):


Here the cheapest stock is again PFE, nearly half cheaper (P/E/ wise) than the 2nd cheapest MDT.

There is a whole collection of most expensive companies, starting with AMGN, followed by and JNJ, CVH, NVO, AET.


You may receive technical analysis and alerts of these stocks, sent automatically to you, by entering the symbols in the Technical Trend Analysis Tool

Stumble Upon Toolbar

Saturday, March 20, 2010

The Top Senior, Intermediate, and Junior Gold Miners and Precious Metals Producers

We track a top group of senior, intermediate and junior gold miners live as one of our Tracking Live sites: Track miners live. Some of the top performers may surprise.
The top senior performer is BVN, Compania de Minas Buenaventura from Peru, followed by Australia's AU, Anglo Gold Ashanti.
The top intermediate producer is by far Centerra gold, CG.
The best performance however, comes from the juniors NCM, Newcrest (+500%) and NG, Novagold (+402%), GSS, Golden Star follows (266%).
Here are screen captures with prices as of today, and performance chart since January 2009.


(please click to enlarge images)

Stumble Upon Toolbar

Top 20 ETFs to Buy and To Sell For Week of March 22: Plus The 'ETF Horribilis'

We calculated the relative strength values of all ETFs that trade in the US and then sorted them by RSI-A. We use the average of all three time frame indicators as it is a closer approximation of the correct buy and sell signals.

These indicators provide a good idea of whether an ETF is oversold or overbought. Some of these values we found are very scary.

Top 20 Most Oversold ETFs:


Look at the monthly indicator for FAZ: 1.02. Now FAZ is a dreadful instrument that should be avoided at all costs. The 2nd most oversold: the equally dreadful UNG, another 'ETF Horribilis' to avoid all all costs.

This is tough investing.

The fact that many of these deeply oversold ETfs are leveraged speaks for itself.

Top 20 to Sell:


The top (as in most overbought) are FBT, FXH, IFNA, XRT. FBT mirrors cross section of companies in the biotechnology industry; FXH is health care. IFNA is real estate and XRT is the retail industry.

Note that FAS, the FAZ counterpart is not on the top overbought list. In fact it only appears in position 204! Stay away from these, as we have said so many times.

You may receive technical analysis and alerts of these stocks, sent automatically to you, by entering the symbols in the Technical Trend Analysis Tool, (powered by INO).

Stumble Upon Toolbar

Friday, March 19, 2010

Fed Must Disclose Record of Financial Bailout, Again!

Bloomberg has won another round against the Fed, see report. A federal appeals court ruled today that The Federal Reserve must disclose documents identifying financial firms that might have collapsed without the U.S. government bailout. Why all the secrecy?

"The U.S. Court of Appeals in Manhattan ruled today that the Fed must release records of the unprecedented $2 trillion U.S. loan program launched primarily after the 2008 collapse of LEH. The ruling upholds a decision of a lower-court judge, who in August ordered that the information be released.

The opinion might not be the final word in the bid for the documents, which was launched by Bloomberg LP, the parent of Bloomberg News, with a November 2008 lawsuit. The Fed could seek a rehearing or appeal to the full appeals court and eventually petition the US Supreme court.

The court was asked to decide whether loan records are covered by the U.S. Freedom of Information Act, or FOIA. Historically, the type of government documents sought in the case has been protected from public disclosure because they might reveal competitive trade secrets. The Board of Governors of the Federal Reserve System had argued that disclosure of the documents threatens to stigmatize lenders and cause them “severe and irreparable competitive injury.” "

Stumble Upon Toolbar

Interest Rates Set To Rise Globally

Yesterday we commented on the possibility of the Brazilian bank rasing rates, which will make them the highest effective rates in the world. The vote was a split 5-3 in favor of staying the course, for now. The hike will likely happen next month.

Today Canada's inflation rate was higher than expected, pointing to a rise on the Canadian rate. The Canadian dollar responded by rising sharply.

Bloomberg today reports that US rates are set to rise as well.

"The Federal Reserve may increase the discount rate, charged on direct loans to banks, before the next meeting of the Federal Open Market Committee on April 28".
The reports cites Micheal Feroli, U.S. economist at JPMorgan Chase: “It’s going to happen at some point,” “Whether it’s today, whether it’s next week or next month is hard to say.”

"The board on March 16 held a 'general discussion of discount window matters' with the FOMC, the Web site said. Such a discussion wouldn’t be unusual either at a time when lending programs, financial stability and bank reserves are all part of the FOMC’s discussion about its monetary policy stance. “There has been no decline in borrowings since the discount-rate increase, which is why it is entirely possible they want to raise the discount rate in the days ahead,” Crandall said. “Their stated rationale for raising the rate was to turn it into what it used to be: a liquidity backstop instead of a primary source of funding.”

Stumble Upon Toolbar

Thursday, March 18, 2010

Alert Optimization and Risk Analysis Tool Results

I received some requests for examples and results of RSI analysis from our new tool. Here are some.

Nokia, NOK

Standard RSI7, 30/70:


(please click to enlarge images)

For NOK the Buy alert success rate after 30 days is 66%. The sell alert success rate is 50%. After 400 days the success rate is 66% for buys, and 90% for sells.

Nokia RSI, 9 28/60 (Buy optimal):


Now the Buy success rate after 30 and 240 days is 80%.

RSI13, 20/76, sell success rises to 100% (sell optimal):


Sell success rate after 30 days and 240 days is 100.0%


USO:

RSI 7, 30/70

Buy success: 72%, sell success: 64%

RSI5, 20/60 (buy success: 100%):


RSI7, 20/78 (sell success: 75%/100%):


VIX:

You cannot buy the VIX of course, buy be careful you understansd the VIX: buying the VIX usually means selling stocks.

RSI7, 30/70:


That is pretty good.

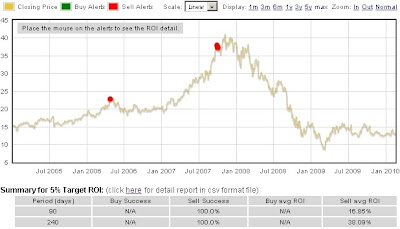
RSI11, 38/60 (sell success 100%, sell ROI 30/39% for holding 90/240 days)


NTRI

RSI 7, 30/70:


RSI5, 22/78 (buy optimal):


RSI5 28/80 (sell optimal):


Goldcorp, GG

RSI7, 30/70:


RSI5, 28/80 (Buy optimal)


RSI7, 20/80 (sell optimal):


BC

RSI7, 30/70:


RSI 7, 20/60 (Buy optimal)


RSI5, 20/72 (Sell optimal):


For requests of other stocks or early access to the tool, please submit a comment or email me.

Stumble Upon Toolbar

Financial TV

Blog Archive

// adding Google analytics